Description
![]()
Torontonians love to hate the TTC. However, compared to transportation systems in other major north American cities, Toronto has one of the better systems. Where other cities’ transportation systems are oriented towards getting people from the outside the center of the city (suburbs) to inside it (downtown), the TTC also provides service for people travelling between suburbs and neighborhoods. The TTC has only 4 subway lines, but they are complemented by an intricate system of streetcars and buses making it easy to get around. The TTC has 192 bus routes and 8,552 bus stops.
This system is not without flaws, and delays are an inevitable part of the commuter’s experience.
In this project, I dive deep into a dataset on TTC bus delays. The aim is to gain insight into these delays and find possible solutions to minimize them.
Objectives
The goals of this project are:
- Explores the data collected on the delays on TTC bus routes.
- Explore the relationship of the delays, time, and location.
- Gain insights into these delays such as the drivers. These insights may be used to develop a solution or to drive further investigation by collecting more data.
Tools

Microsoft Power BI was used to explore and visualize the dataset.
The Data
This dataset used is the Toronto Bus Delays 2022 dataset from Kaggle. This dataset is also available from the city of Toronto’s open data website. It has 10 features and 27,351 records. It covers the period of January to June 2022.
Data Cleaning and Preprocessing
Preprocessing focused on the variable ‘Direction’ which indicates the which direction a particular bus was travelling when it experienced delays. The expected values for these are B (both ways), N (north), S (south), E (east), and W (west). Rows with other variables other than these were removed. A total of 21,765 row remained.
Dashboard & Key Insights
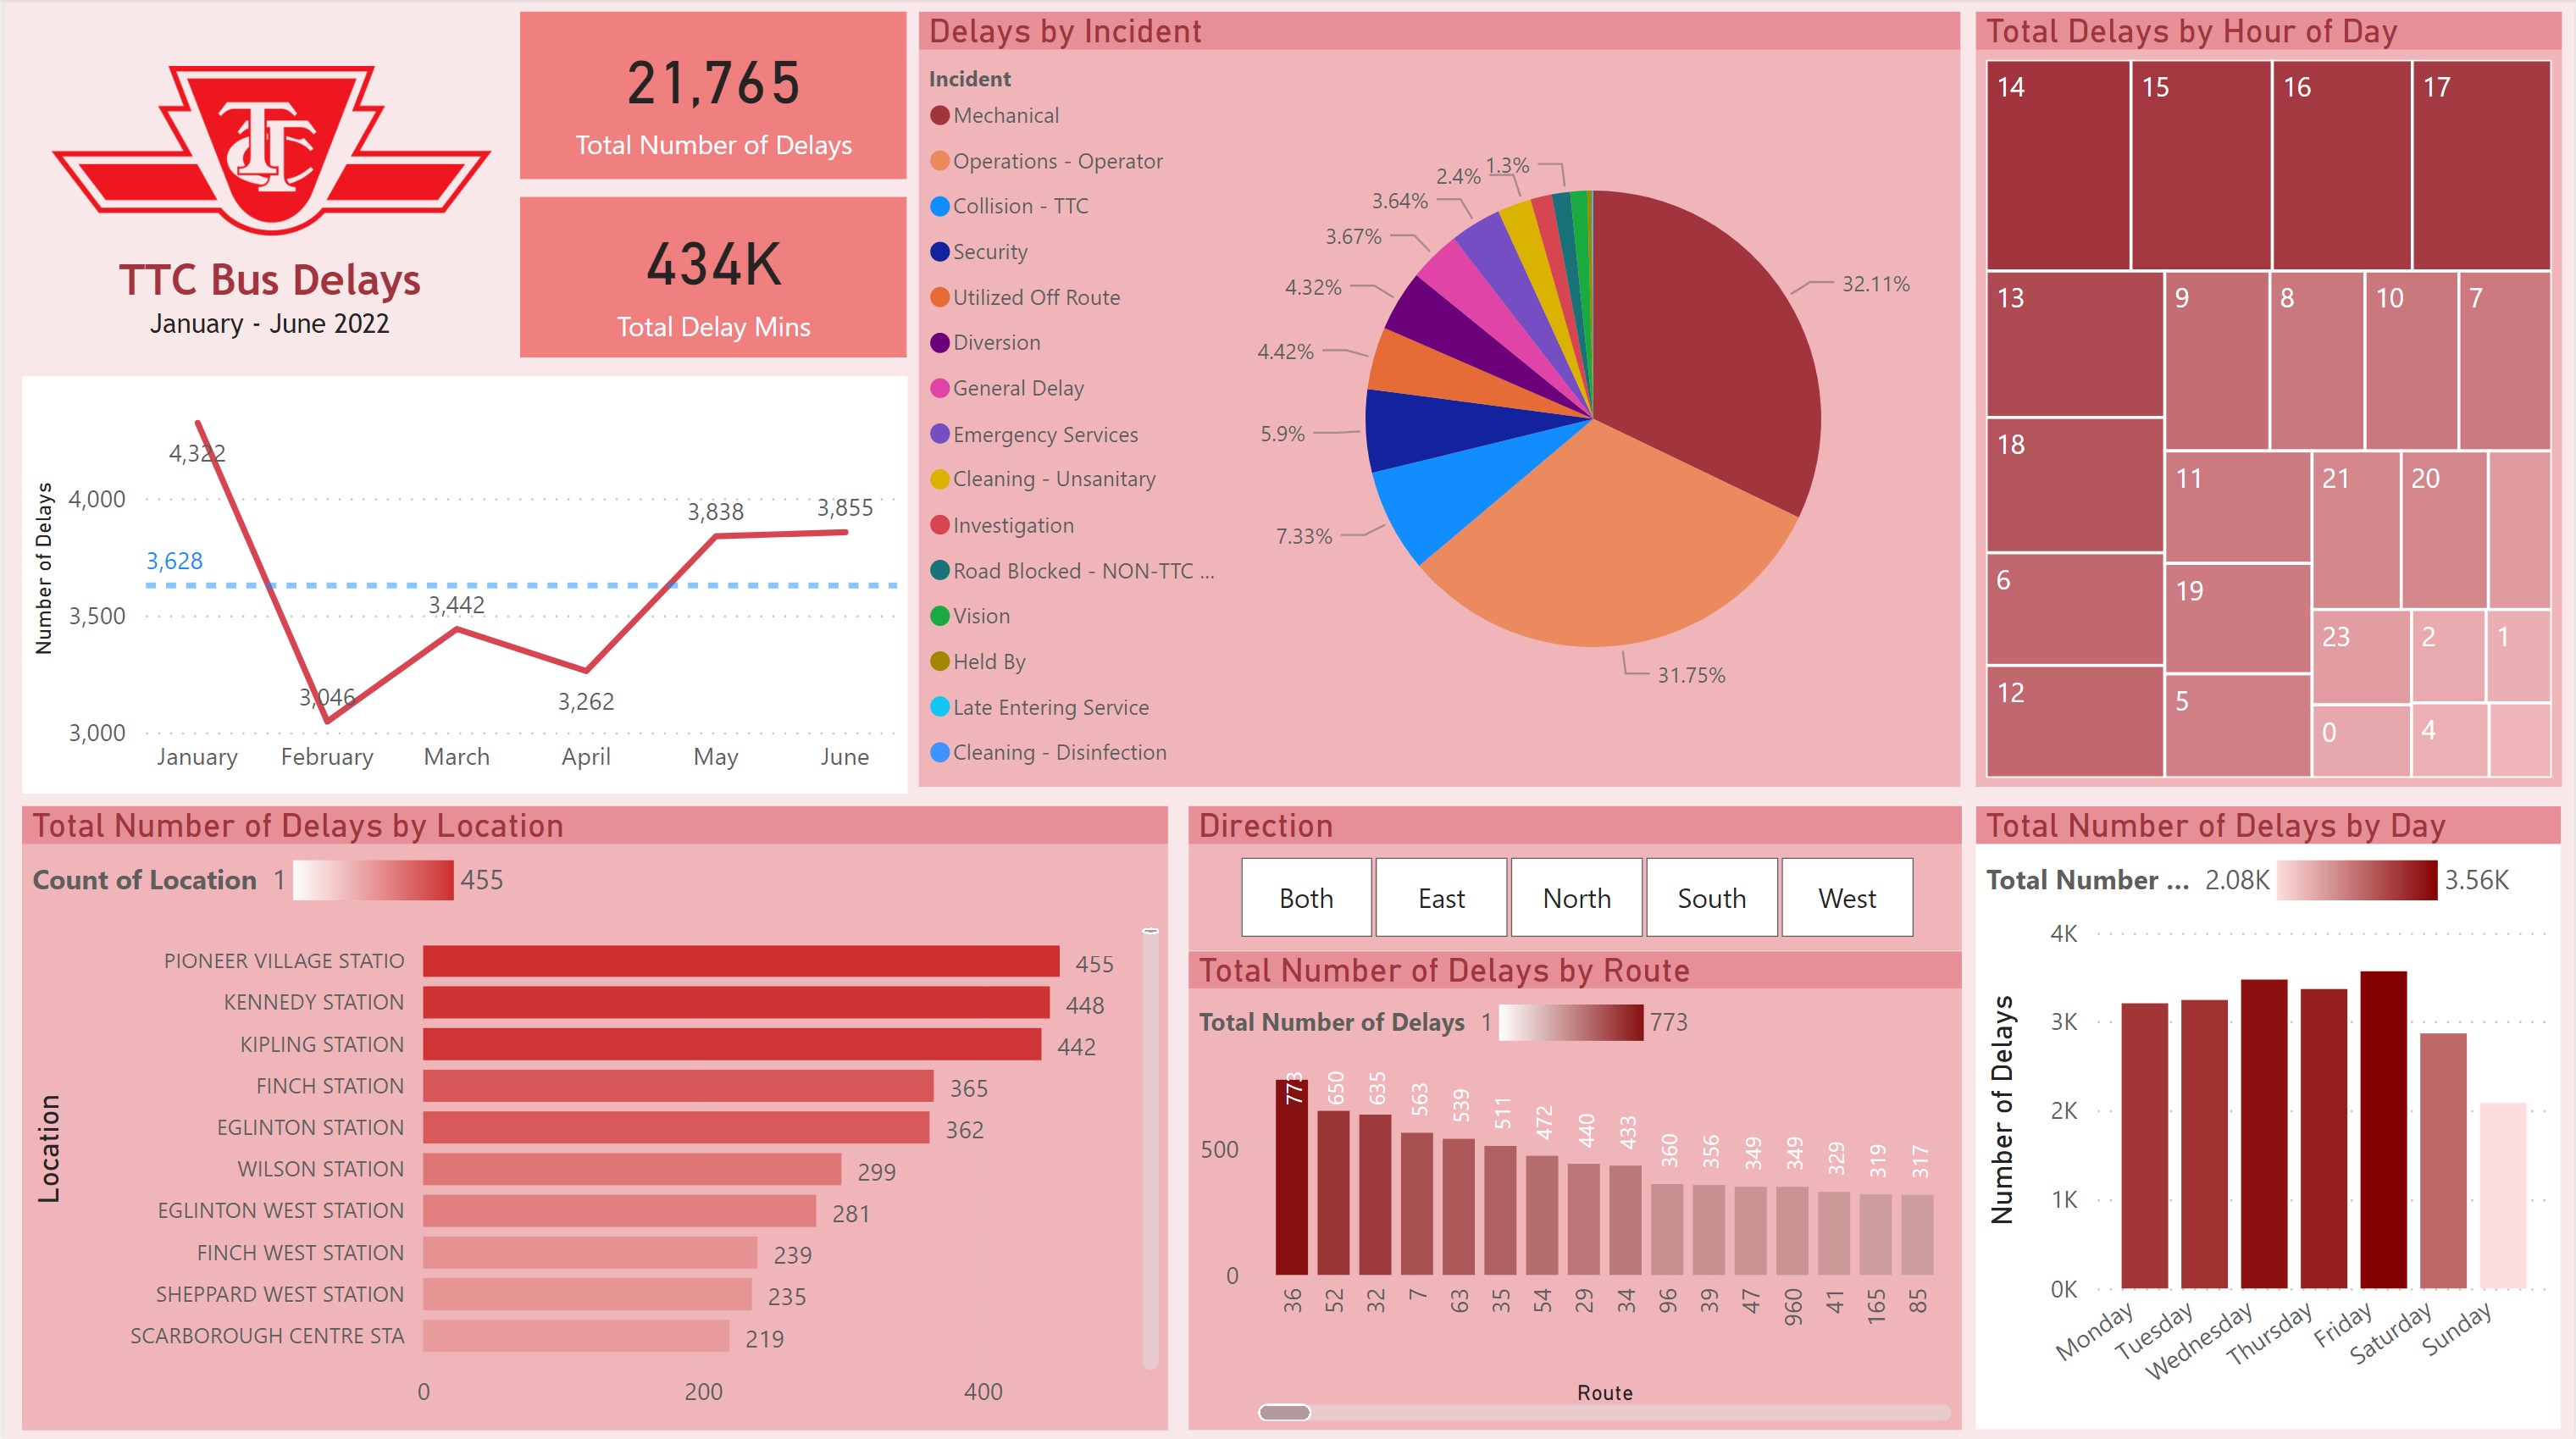
There were 21,765 bus delays during the first half of 2022.
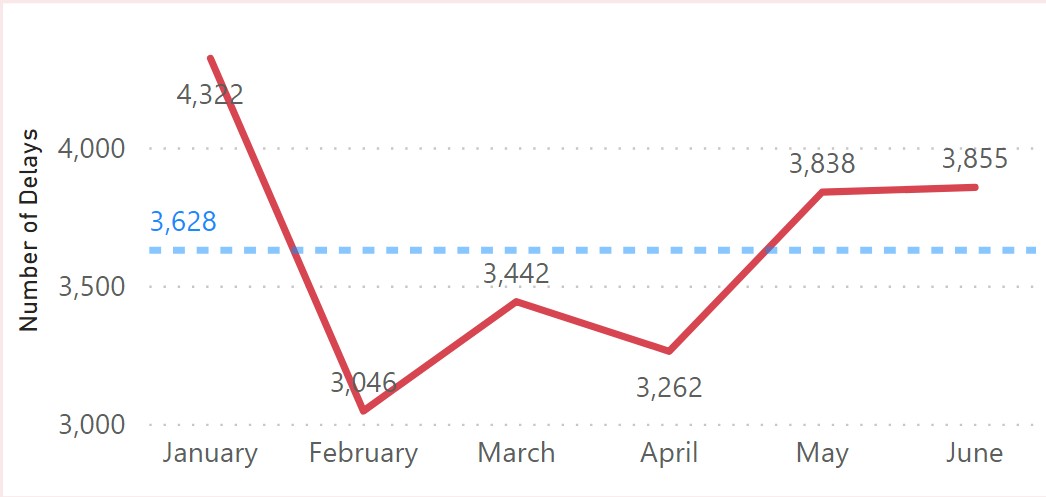
January had the highest amount of delays at 4,322 which sharply decreased in February down to 3,046. The number of delays has gradually increased in the following months. The average number of delays per month is 3,628.
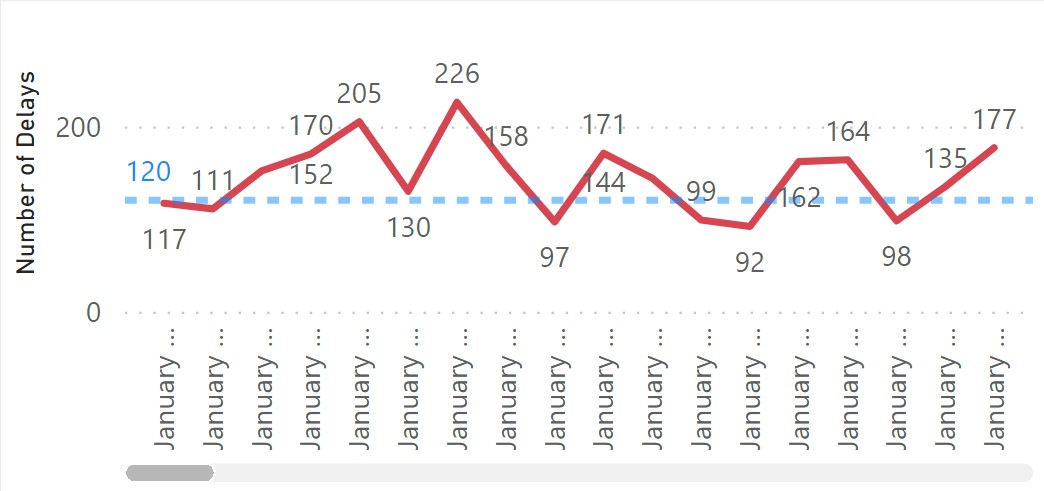
The daily average number of delays throughout this period is around 120 per day.
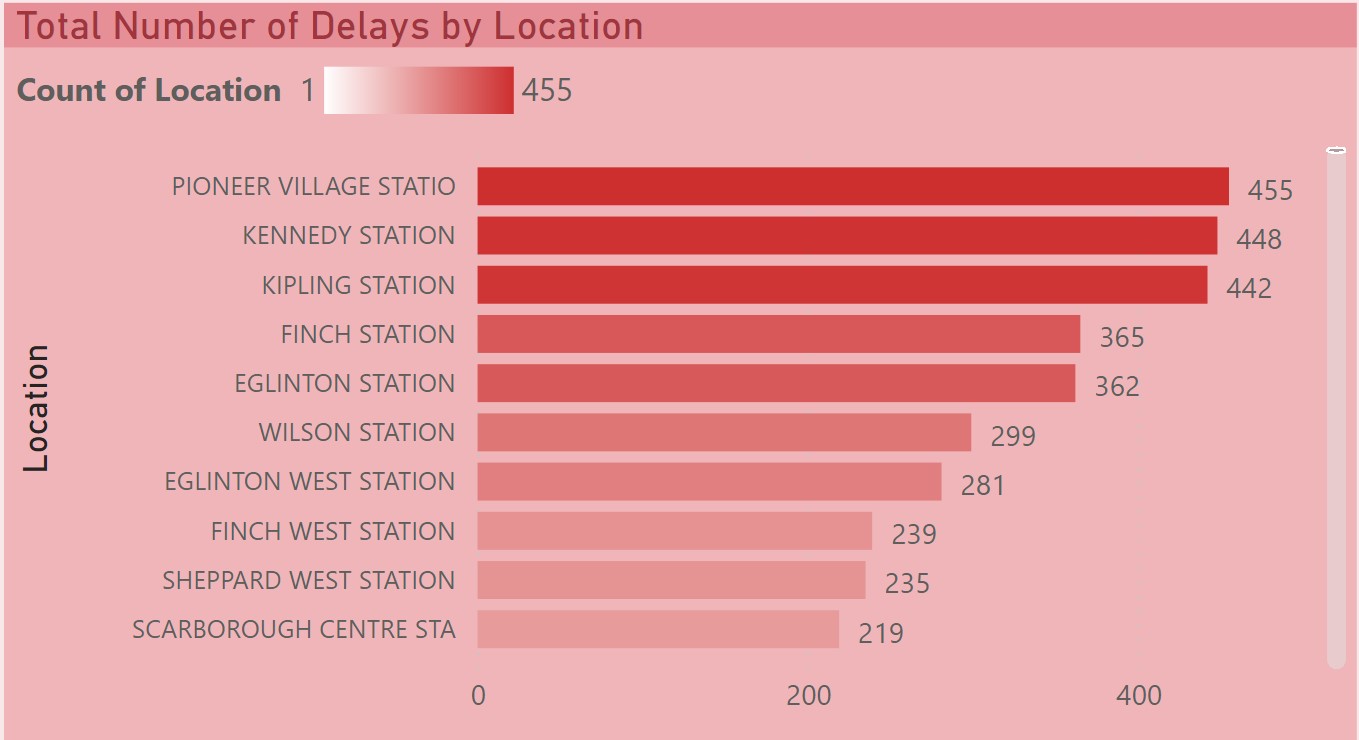
Pioneer Village station, Kennedy station and Kipling station were where most delays occurred.
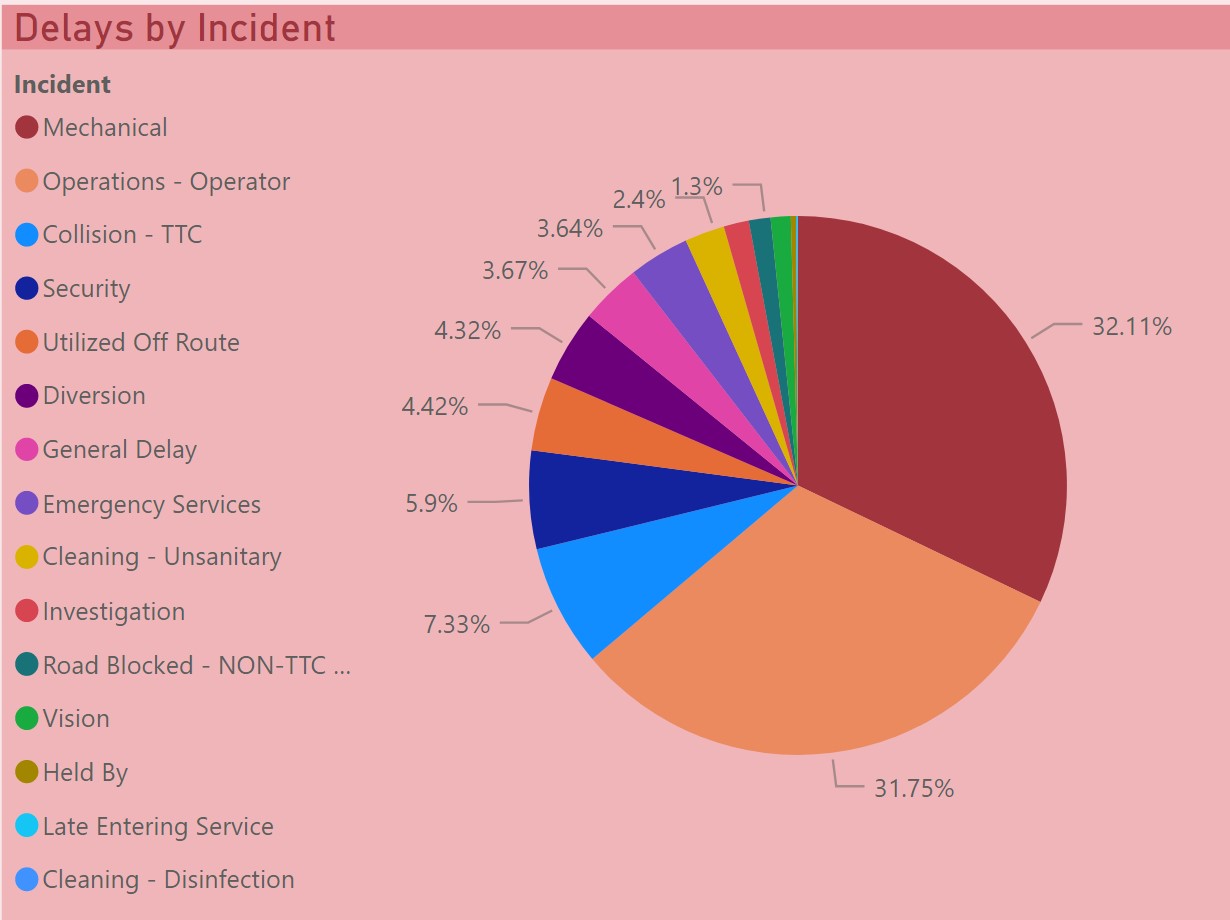
The 2 major causes of delays are equipment (Mechanical) and personnel (Operations - Operator). Together, they account for 63.86% of all delays.
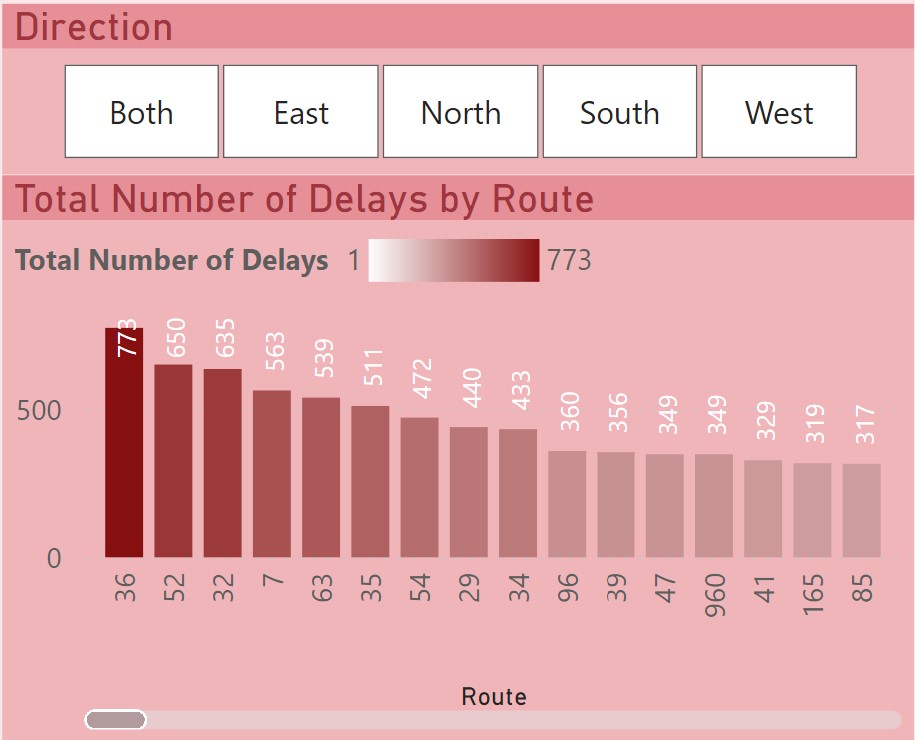
Bus route 36 which travels along Finch had the most number of delays at 773. This was followed by route 52 which travels along Lawrence with 650 delays. Route 32 which travels along Eglinton West is in third place with 635 delays.
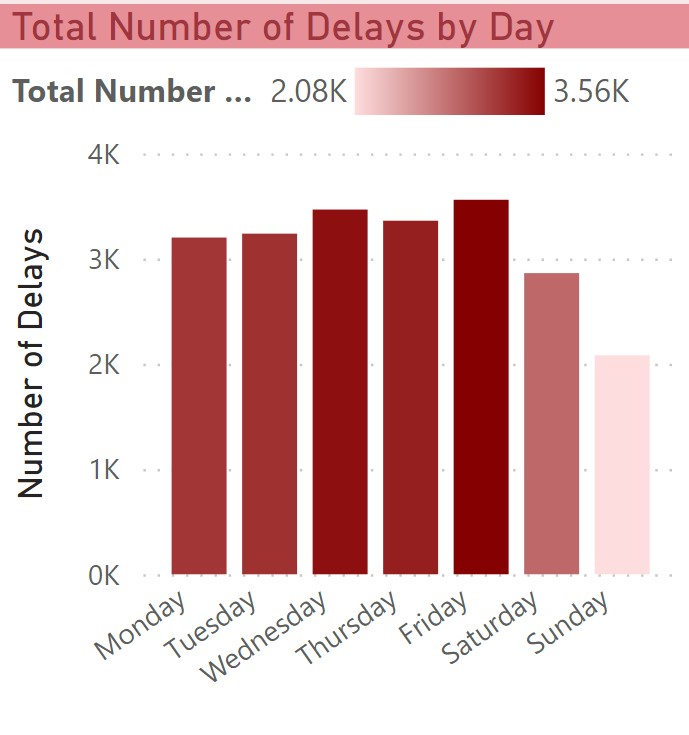
Most delays occur on Friday, Thursday and Wednesday.
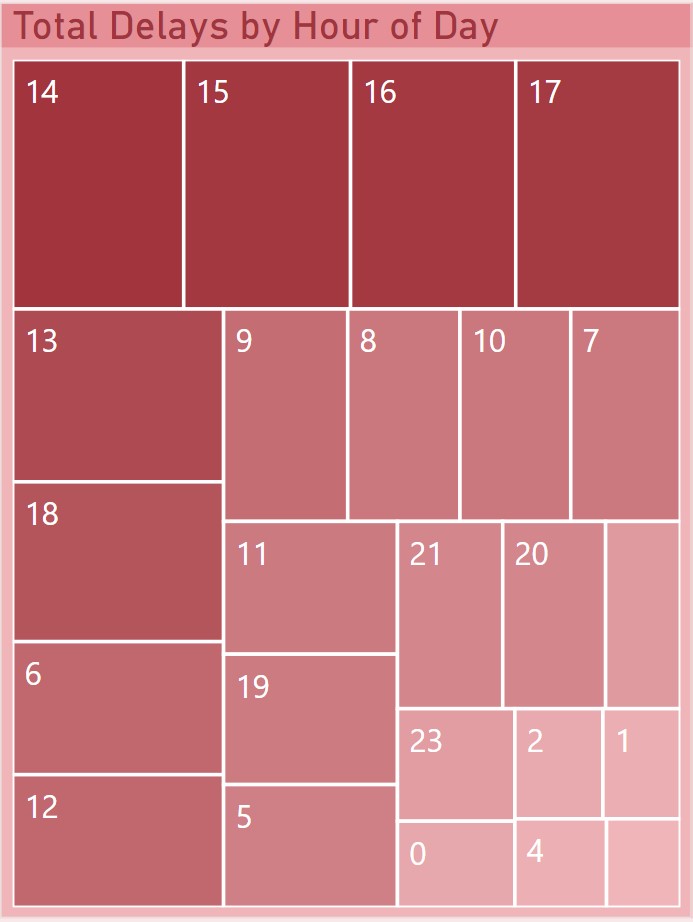
During the day, a greater number of delays occur in the afternoon between 2-5pm.
Implications and Future Direction:
- Gather complete data on vehicles used and the delays reported to see which vehicles cause more delays than others.
- Get more details on the delays caused by mechanical incidents so that proper measures can be taken to reduce these delays based on the nature of the mechanical incidents.
- Get data on operators and check their number of delays. Find measures to reduce personnel related delays.
- Check the reason for the high number of delays in January (Winter season? Annual maintenance of vehicles? Manpower availability?).
- Look into why there are more delays in the afternoon.
- Consider reallocating resources to locations/stations with most delays in order to reduce the instances in these locations.